Our New Universal App Campaigns Dashboard
When approaching an optimization process, the most important thing is to have all the data in front of you, ready to be filtered according to your needs.
Three months ago, Google merged two models and is now using the “Universal App Campaigns” model for mobile devices. Due to this change, we had to adjust our data model, in order to keep presenting a whole data set for our Account Managers so they could have all the data they need for optimization. Introducing – yellowHEAD’s new UAC dashboard.
Gathering all the new data from two different APIs under one dashboard is crucial for a proper optimization process. Think about it – when managing a large-scale activity with multiple campaigns, you must have the ability to analyze performance per campaign, geo, OS, network, specific dates and other essential breakdowns, according to what’s relevant to you.
Account managers’ decisions are based on data, and plenty of it, which is exactly the reason why the new UAC dashboard is the perfect product for our team of experts. Previously, we had to export reports manually and create a final dashboard without “extra” breakdowns, in a much more complicated way – this took us a long time. Now, thanks to the new UAC dashboard, it’s all being done automatically and in a live updating stream. We also have new options, such as network breakdown, that significantly improve our tool box.
All these new features and breakdowns are presented in an innovative visual dashboard, which leaves all old reports in the past.
The New Universal App Campaigns Dashboard:
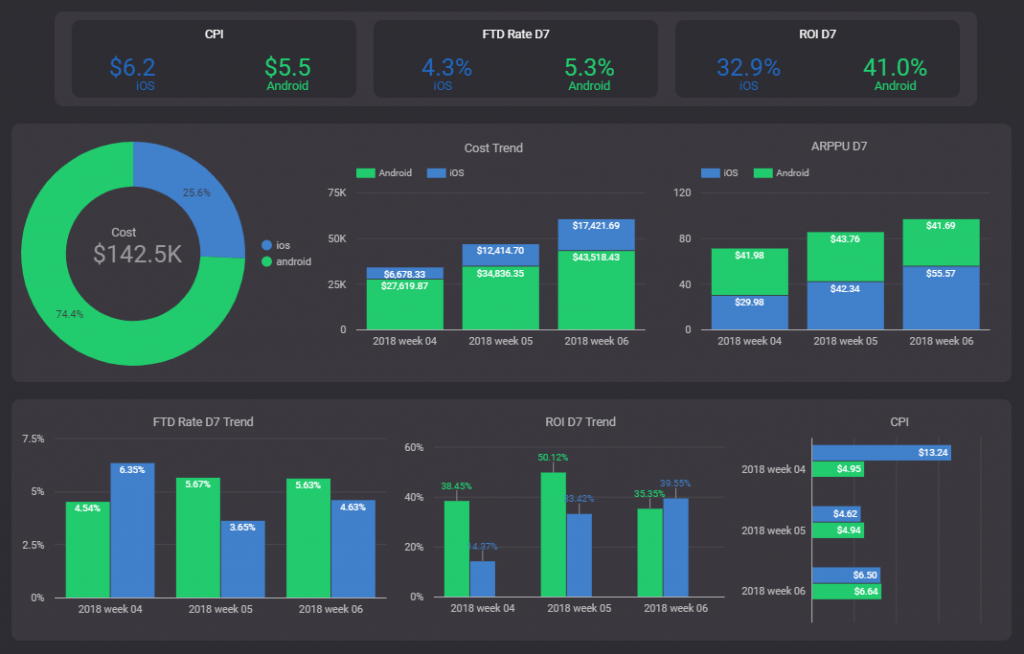
So, what are the important breakdowns in data that we have today?
Let’s explore the main ones:
- Breakdown to weeks and months gives us an overview of how we performed in previous weeks and months in comparison to the present time and helps us reveal repetitive trends or peaks. This breakdown analysis is like a bird’s eye view over the entire activity and provides deep understanding for optimization.
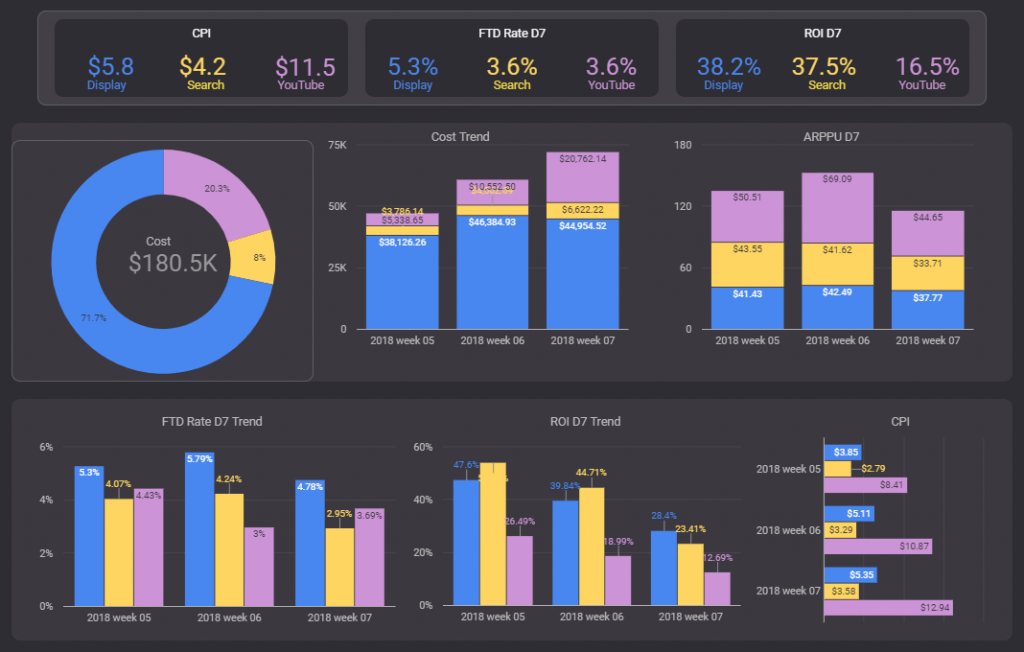
- Breakdown by Network is probably the most innovative aspect of the new UAC dashboard. Now, unlike before, we can see performance breakdown by network – also referred to as Search, Display, and YouTube. We’re able to know how much spend was dedicated to each network, as well as ROI results, CPIs, and all other metrics we usually see and analyze. We can also filter per campaign, OS, activity, etc. We are confident that this addition will enrich our ability to deliver better results.
Breakdown by Network:
- Geo Analysis takes all data regardless of campaigns’ attribution and presents it in the best way to examine each geo’s performance separately. From our experience, most clients tend to globalize their services. Presenting geos’ breakdown is therefore highly relevant these days and has proven to be useful when planning action items per geo.
To summarize, the new UAC dashboard is great for all sides, and gives us the ability to optimize and display performance results to our clients in a unique and highly professional way that was not available in the past. Using these new features truly sets a new high standard for optimization of Universal App Campaigns.