How To Choose an ASO (App Store Optimization) Tool
App Stores Are Black Boxes. How Should You Choose an ASO Tool?
As a digital marketing company that leads App Store Optimization efforts for apps of all sizes, categories, and markets, we make critical decisions based on a wide variety of metrics. These metrics range from an app’s organic-paid install trends, keyword rankings, star ratings, review history and much more. As such, we look to ASO tools for the most accurate and comprehensive data.

What makes a good ASO tool?
While we’ve developed our own perfection with the yellowHEAD Analytics Platform (we’re humble), in parallel we continue to utilize a variety of partner tools for research and tracking.
A good ASO tool is one that provides the most relevant and accurate app store metrics, preferably in one place. These metrics include:
- installs data
- reviews
- version update history
- keyword rankings
- and keyword traffic.
This last one is especially critical – and tricky.
With keywords being a central component of app store search optimization, it’s extremely important that the keyword traffic data is as accurate as possible. But how accurate can we expect any tool’s keyword traffic scores to be?
In the case of iOS, Apple Search Ads has shined some light for several main markets, providing search popularity for phrases on a graphic scale (The Tool’s extension converts this into numbers). Because this metric comes from the horse’s mouth, a reliable ASO tool will use it for search scores in the US, and possibly include it for other relevant countries (more on this later!). SO, you have an easy way to check the reliability of the tool by simply comparing their scores with those of ASA.
For non-ASA markets, the popularity is more difficult to estimate – and therefore the accuracy is more difficult for us to check. Which brings us to a similar situation as with Google Play.
Unfortunately, Google Play and non-ASA iOS are “black boxes” for search query data. Google and Apple do not provide absolute search volumes about specific queries. So, we are left to rely on smart ASO tools to deliver keyword search volume estimations.
How do they do it? Let’s have a look at a few methods some of the more popular ASO keyword tools employ.
Ways to estimate keyword search traffic
When estimating keyword traffic, three main methods include simply using web search volume (via tools like Google AdWords), surveying a pool/community of users on app store search behaviour, or calculating numeric traffic scores based on various available data points. Let’s break down all three.
1. Web Search Volume – Google Adwords
Pros:
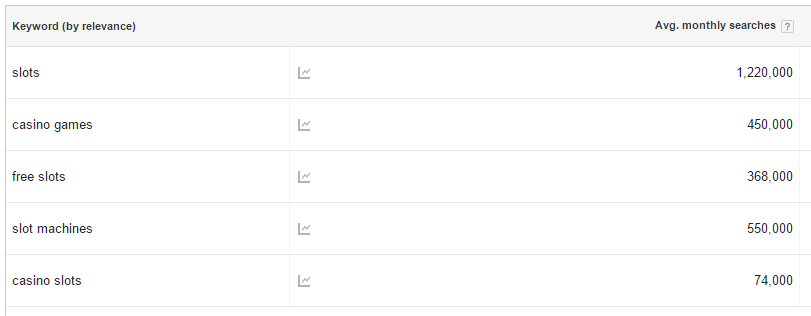
The obvious advantage of using web search volume to gauge app store search traffic is that the data is easily available and intuitive. Tools like Google AdWords provide monthly numeric search volumes worldwide or by country and language, like below.
Cons:
The problem with solely relying on web search volume is that search behaviour in web search engines is quite different than in mobile app stores. Keywords that include terms like “messenger”, “gps”, or “fitness tracker” will receive significantly more traffic in the app stores than on the web, as they are almost exclusively associated with mobile apps. Similarly, search queries such as “what time is it in new york” or “who was the 16th president of the united states” will get a considerable amount of searches on the web, but virtually none in app stores.
So while search volume alone should not be relied on for determining which keywords to target in app store listings, it’s not a bad metric to use as a supplement to other data, like Google Trends. The fact that it’s publicly available in search volume ranges, rather than a score, makes it an indicator of overall interest. When used alongside traffic scores from an ASO tool, it also provides insight on any existing relationship between web and app store search behaviours.
2. Surveying Pools/Communities of Users
There are ASO providers who choose to leverage communities of incentivized users to gauge keyword search volume. They offer community members rewards such as app store credits to complete surveys on their search behaviour. For example, they might show you a specific app and ask, “what phrases are you most likely to search for when searching for this app?”
Pros:
There are several advantages of estimating search volume in this way: Results are very straightforward, the sample size can reach thousands (but is mostly several dozens), and what users claim they might search for sometimes (but not always), correlates with what they actually search for.
Cons:
The downside of using such a methodology is clear. First, the data’s sample size is limited to the size and demographic of the community. If your community is predominantly males in their 20s, their search behaviour and interests will be significantly different than that of, let’s say, females 40+. A young male community may be fluent in the search language of dating apps, but have no valuable insight into search terms for slots games, which mainly appeal to women 40+.
Second, the surveys are given outside the environment of the app store. This is problematic for a number of reasons. When in the app store, users are focused on finding an app to fulfil a need, not a psychological exercise, and behave differently when they have actually clicked inside the search bar.
Surveys also don’t offer search suggestions like the app stores do, which may alter the query that the user ultimately searches for. If a user opens the search bar and intends on searching for “taxi app” and gets the suggestion “taxi app free rides”, they may end up selecting that suggestion, thereby altering the intended search. An individual filling out a survey would not have this change of mind and may not provide “taxi app free rides” as an answer at all.
3. Calculating Numeric Traffic Scores
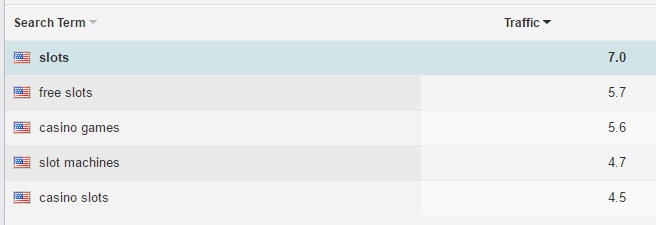
This is the way that some of the most popular ASO tools provide traffic scores. For example, Mobile Action and Sensor Tower factor in data from various available sources to calculate a traffic score for every query on a scale. While Mobile Action uses a scale of 0-100, Sensor Tower uses 0-10.
Some of the main factors that are considered in traffic score calculations typically include:
- Mobile Web search volume – While web search behaviour is indeed different (as discussed above), a correlation does exist between mobile web searches (i.e. google search from mobile, not desktop) and app store searches.
- Apple’s Search Ad popularity scores – These traffic scales can now be factored in for iOS traffic scores in the US and other markets where available. However, after careful review, our friends at Mobile Action have found that in non-US countries, these scores are more indicative of the popularity of advertisers for a keyword, not of user searches. Their platform therefore provides both the ASA search score as well as the Mobile Action estimate for non-US countries where ASA is available.
- Search suggestions, Autocomplete & Trending – Search suggestions and recommended long-tails via autocomplete are good indicators of commonly searched keywords, offering valuable insight into their popularity. Suggestions can be incorporated into traffic scores in different ways. For example, Katerina from The Tool has shared with us they measure how long it takes for the keyword to appear in the suggestions, and in which position it appears, among many other factors.
- Relationship between apps’ keyword rankings and any peaks in their installs – If an app’s keyword ranking for a particular keyword, let’s say “slots”, increases along with a peak in installs, it may suggest that many users are searching for “slots” and downloading the app. This is a popular metric for tools that properly track what’s happening in the stores.
- Characteristics of the keyword – The Tool, among others, has cited the length of the keyword as an important factor. Naturally, users will not invest as much time in typing out longer words as they would shorter, common words.
The major benefit of the above approach is not only that the scores consider a portfolio of data points rather than relying on just one, but also that the sample size of the data is much larger than you would get from a community survey. With that said, it’s important for ASO tools to adapt along with industry trends and consumer behaviour by continuing to adjust their formulas accordingly.
yellowHEAD’s Approach
At the end of the day, the choice of which ASO tool and what data you use to drive your ASO efforts is up to your beliefs. We want to use a tool that gives us up-to-date, reliable data that we can derive the best ASO strategy from.
We have examined and use several ASO tools in parallel and have found advantages and disadvantages with each of them.
From Sensor Tower to Mobile Action
Internally, we recently decided to switch from Sensor Tower to Mobile Action as our main keyword research and tracking tool for several reasons. We found similarities in the traffic score estimates when tracking hundreds of keywords in different geos, indicating similar methods for calculating the scale. With that accuracy to rely on in both platforms, we found Mobile Action’s features for keyword research, tracking, and integrations much more all-encompassing. But the main advantage, as we see it, was the flexibility of the developers behind the scenes to answer our requests for very particular features that we need.
That said, at yellowHEAD we believe in cross-checking our data – not for suspicion in the accuracy of our tools, but to get a bigger picture, from various points of view. This is how we treat most of our work processes and we’d recommend this approach to anyone doing ASO. We’re exposed to different methods, kept on our toes, and aware of the latest trends in the mobile and ASO industry.
For example, knowing what’s going on with web search trends (e.g. voice search queries) can help us investigate and understand app search trends as well. We regularly supplement our research and tracking with additional tools like The Tool, App Radar, AppFollow and AppAnnie (to name a few) for additional insights.
And, the best example: GPDC Search Keywords.
Our Advice: Check Which Keywords are Bringing Installs
You want accurate? Look at your own app! Check out which keywords are bringing visitors and installs through the Search feature on GPDC. Although it’s fairly new, these metrics lend us incredible insights that were never available before (save a short stint in beta). While ASO tracking tools will show you the traffic scores of keywords as ‘potential’ for targeting, the keywords that are currently bringing you traffic are an important metric to consider for ASO.
[As a side point, we predict that this data will become one of the data points that ASO tools use to estimate traffic scores, since integrated apps grant these tools access to their GPDC accounts.]
Conclusion
As Google and Apple continue to refine their ranking algorithms, keywords continue to be a more and more slippery factor in ASO. With that said, it’s increasingly important to stay on top of the most accurate keyword data to drive your App Store Optimization strategy.
In the meantime, when evaluating which ASO tool to use as your main keyword research source and ASO tracking platform, make sure you understand what data points are considered in their traffic score estimates. Try using a combination of tools as well, so you don’t miss out on different POVs for insights.